Feature engineering
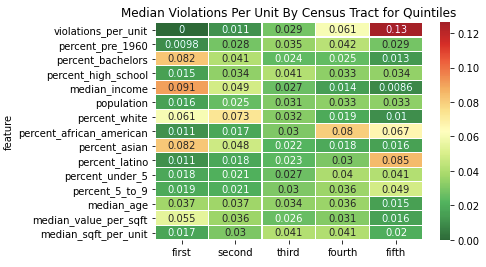
By looking at violations and complaints per unit at the census tract level, we were able to identify several trends along demographic and economic lines. For this analysis we focus on violations and complaints per unit built before 1960. The median violation and complaint rates among census tracts in the upper quintiles for percent Latino or African American population were significantly higher than the city overall while those higher in white population ranked below the city-wide median. Likewise for economic factors such as median income or the percent of the population who have at most a high school education, census tracts with disadvantaged populations have higher rates of violations and complaints, whereas those with highly educated and high income residents experience fewer violations and complaints than the city as a whole.
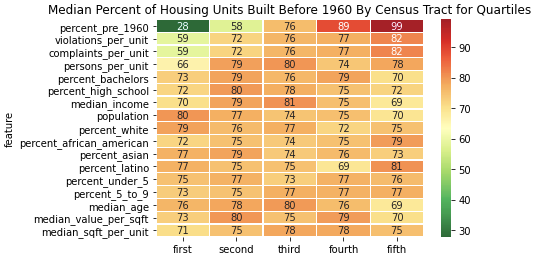
However, these trends were generally not as visible when looking at the age of housing stock along the same lines. In fact, the average age of buildings in the upper quartiles for white population and median household income was actually older than that of the upper quartiles for African American population or percent with at most a high school diploma. Looking at the total share of housing in each tract built before 1960 shows a similar trend. While the percentage is generally higher in tracts with a higher population of disadvantaged groups, the share differs only a few percent in most cases. This suggests that disadvantaged groups may not be more likely to live in housing built before lead paint was made illegal, rather they’re simply more likely to live in similar housing that is more poorly cared for or renovated.
Time series analysis
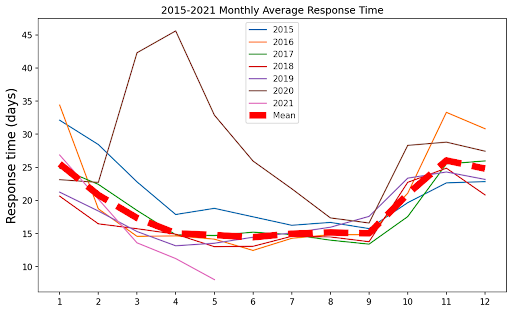
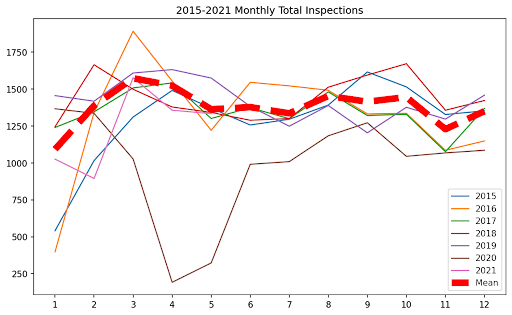
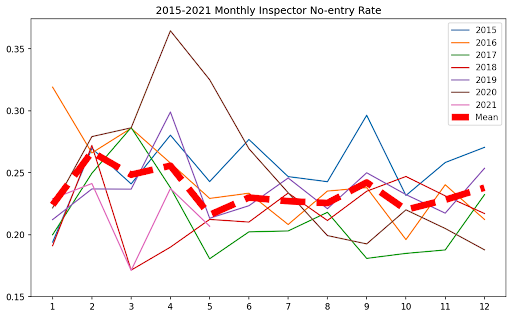
By observing the monthly response time and the total number of inspections, we can see that the workload of the inspectors from March to July in 2020 is significantly affected. The response time has been extended by an average of 20 days, and the number of inspections per month is only about 50% of the previous.
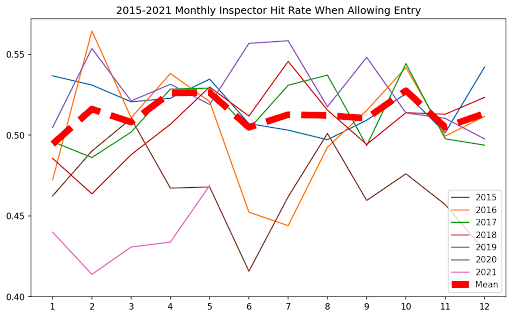
In the next two pictures, we can see that inspectors are more likely to be denied entry during the epidemic than usual. However, even if we only calculate the hit rate when entry is allowed, the hit rate is still lower than in previous years. The reason may be that there are more violations in the apartments that deny access to the inspectors.
Modeling
Our linear regression model of tract-level violation rates shows results that appear to echo our exploratory analysis.
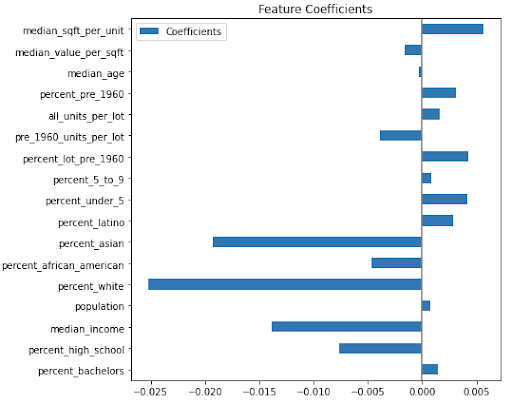
There is a strong inverse correlation between the amount of white population in a tract and its rate of violations. The same is true for median income. Features associated with the overall age of the housing stock are, however, less important to the model, again echoing our earlier analysis.
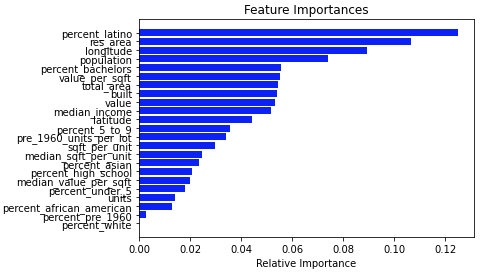
For our classification models we gathered various performance metrics and documented feature importance for our Random Forest Classifier.
| Accuracy | Precision | Recall | F1 | AUC ROC | Specificity | |
|---|---|---|---|---|---|---|
| Random Forest | 0.52 | 0.52 | 0.97 | 0.68 | 0.51 | 0.52 |
| Bagging | 0.52 | 0.52 | 1.0 | 0.68 | 0.51 | 0.52 |
Random Forest Classification Model Performance
Both models produced a high number of false positives. This is likely due to the distribution of the features in the dataset overall. Because certain characteristics are overly represented in the complaint dataset, there is little variation in these features for the model to learn from.
Interactive Visualization Tool
Based on the open source tool kepler.gl, we completed a visualization tool. Sponsors can use the Filter function in the tool to display the data they are interested in on the map and observe the correlation between data in different dimensions. The link is as follows: